
Category-level insight
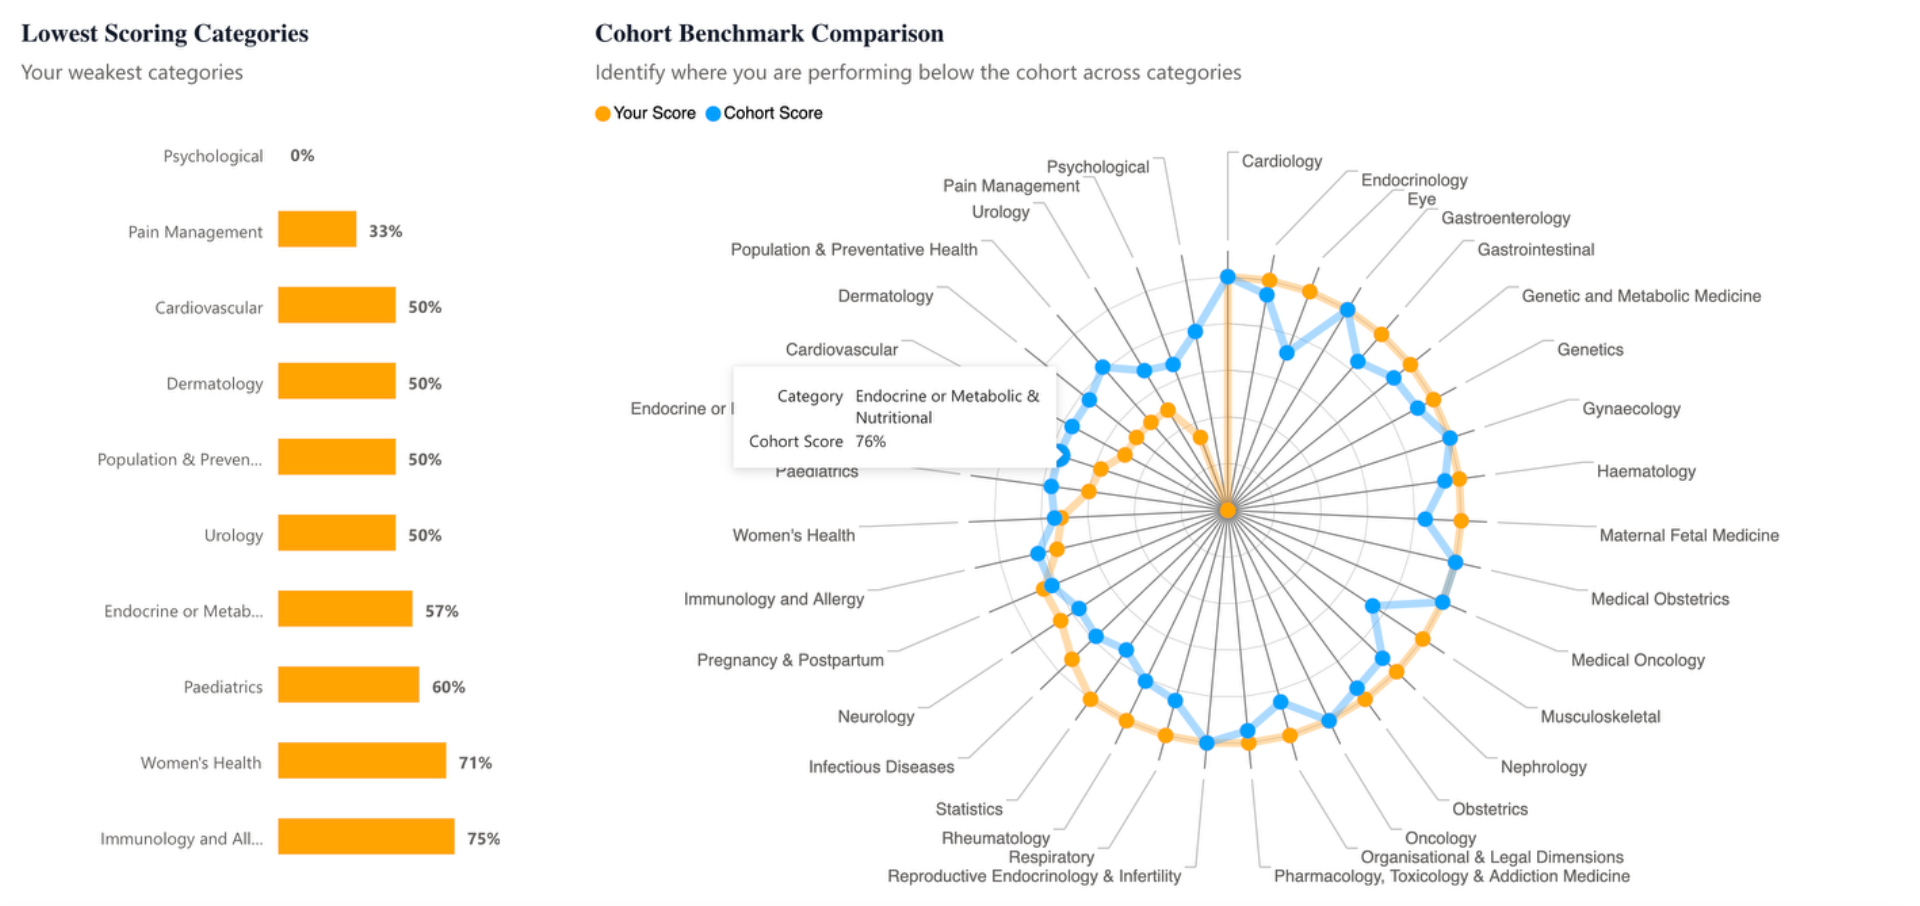
Identify persistently weaker clinical areas and focus revision where it is needed.
See the pattern.
Know your next move.
See your category results, compare them with the PassGP cohort and track progress across written mock exams.
Inside PassGP Performance Analytics
Use your mock-exam results to make the next revision session purposeful.
Identify persistently weaker clinical areas and focus revision where it is needed.
Place your results in context alongside the wider PassGP cohort.
Look beyond a single attempt to recognise improving or inconsistent performance.
Bring multiple performance indicators together as a guide to written-exam preparation.
Review your category results, practise a weaker area, then compare your next timed attempt. For individual feedback, explore 1:1 teaching.
Review available banks, mocks and inclusions for your pathway.
Explore exam packagesWork through your reasoning and preparation priorities with an examiner.
Explore individual teachingDelivered by former AHPRA National Senior Policy experts.
Explore AHPRA supportGet individual feedback on your exam technique.
Explore 1:1 teachingRehearse timing, structure and clinical performance under pressure.
Explore mock examsUse structured resources to support candidates and teaching conversations.
For supervisorsBuild clearer clinical and professional communication through coaching.
Explore coachingStart with a category that is repeatedly difficult, then review the explanations behind those answers. This helps you work out whether you need to revisit the knowledge or practise how you interpret and approach the question.
Use that as your next revision priority, and compare your results after further practice.
Analytics helps you make sense of your mock-exam results: where you’re doing well, which clinical categories need attention and how your performance is developing over time.
That gives you a more personal starting point for revision than working through every topic equally. You can focus on the areas your own results highlight.
The score brings together question difficulty, consistency, cohort comparison, category performance and the median of your five most recent mock examinations.
It gives you a broader view of your preparation than a single percentage, helping you identify what to work on next alongside your practice results and examiner feedback.
Cohort benchmarking places your results alongside the wider PassGP cohort. It adds context to your own scores, while your category results and progress over time show where to focus your preparation.
Use the analytics available with your enrolled mock-exam resources to review your results over time. Look for categories that are improving, recurring gaps and greater consistency between attempts.
If you need help finding the analytics available with your resources, contact us and let us know which exam and package you’re using.
Use analytics to choose your revision priority, then select the PassGP resources that support that goal. Question banks help you practise clinical reasoning and answer selection; flashcards reinforce key knowledge; and the AI Virtual Tutor can help you explore difficult concepts. Where included in your package, small-group teaching and bespoke 1:1 examiner sessions add discussion and tailored feedback. Together, these tools give your study plan a clear purpose.
Sign in to your enrolled PassGP Mock Exam resources to access the available analytics. Question-bank integration is being introduced progressively, so availability depends on the resource you’re using.
If you’re not sure what’s available in your package, ask us and we’ll help you find the right starting point.
Sick of second guessing what the examiner wants? Hear from our Chief Examiner, A/Prof Eskander, as he explains how to display perfect exam technique for the CCE and not run out of time.